Your cart is currently empty!
Build a Google Sheets Stock Portfolio Tracker: (Step-by-Step, No Coding 2025)
Money should feel simple, not stressful. This free Google Sheets Stock Portfolio tracker turns market chaos into clarity. In a single session, it’s possible to build a live, real-time dashboard that shows exactly what’s owned, what it’s worth, and how it’s growing.
No subscriptions, no coding—just transparent, customizable tools that put investors back in control. If the goal is to build wealth slowly and confidently, this becomes the daily check-in that keeps actions aligned with plans.
Why This Google Sheets Stocks Tracker Is More Than a Spreadsheet
- Build ownership and discipline: Manually curating a tracker reinforces position sizing, risk awareness, and rebalancing cadence.
- Replace noise with signal: One clean sheet beats ten scattered apps—see allocation, ROI, and top performers at a glance.
- Clarity under pressure: In volatile markets, a personalized dashboard keeps focus on process (cost basis, long-term return, risk).
- Make compounding visible: Seeing gains, cost vs. value, and allocation makes compounding tangible and motivates consistent contributions.
- Custom > generic: Most apps lock features or data. Here, every metric and chart is yours—auditable, expandable, and free.
What You’ll Build
- Portfolio holdings sheet with live prices via GOOGLEFINANCE
- Auto-calculated metrics: total cost, current value, gain/loss, ROI, allocation
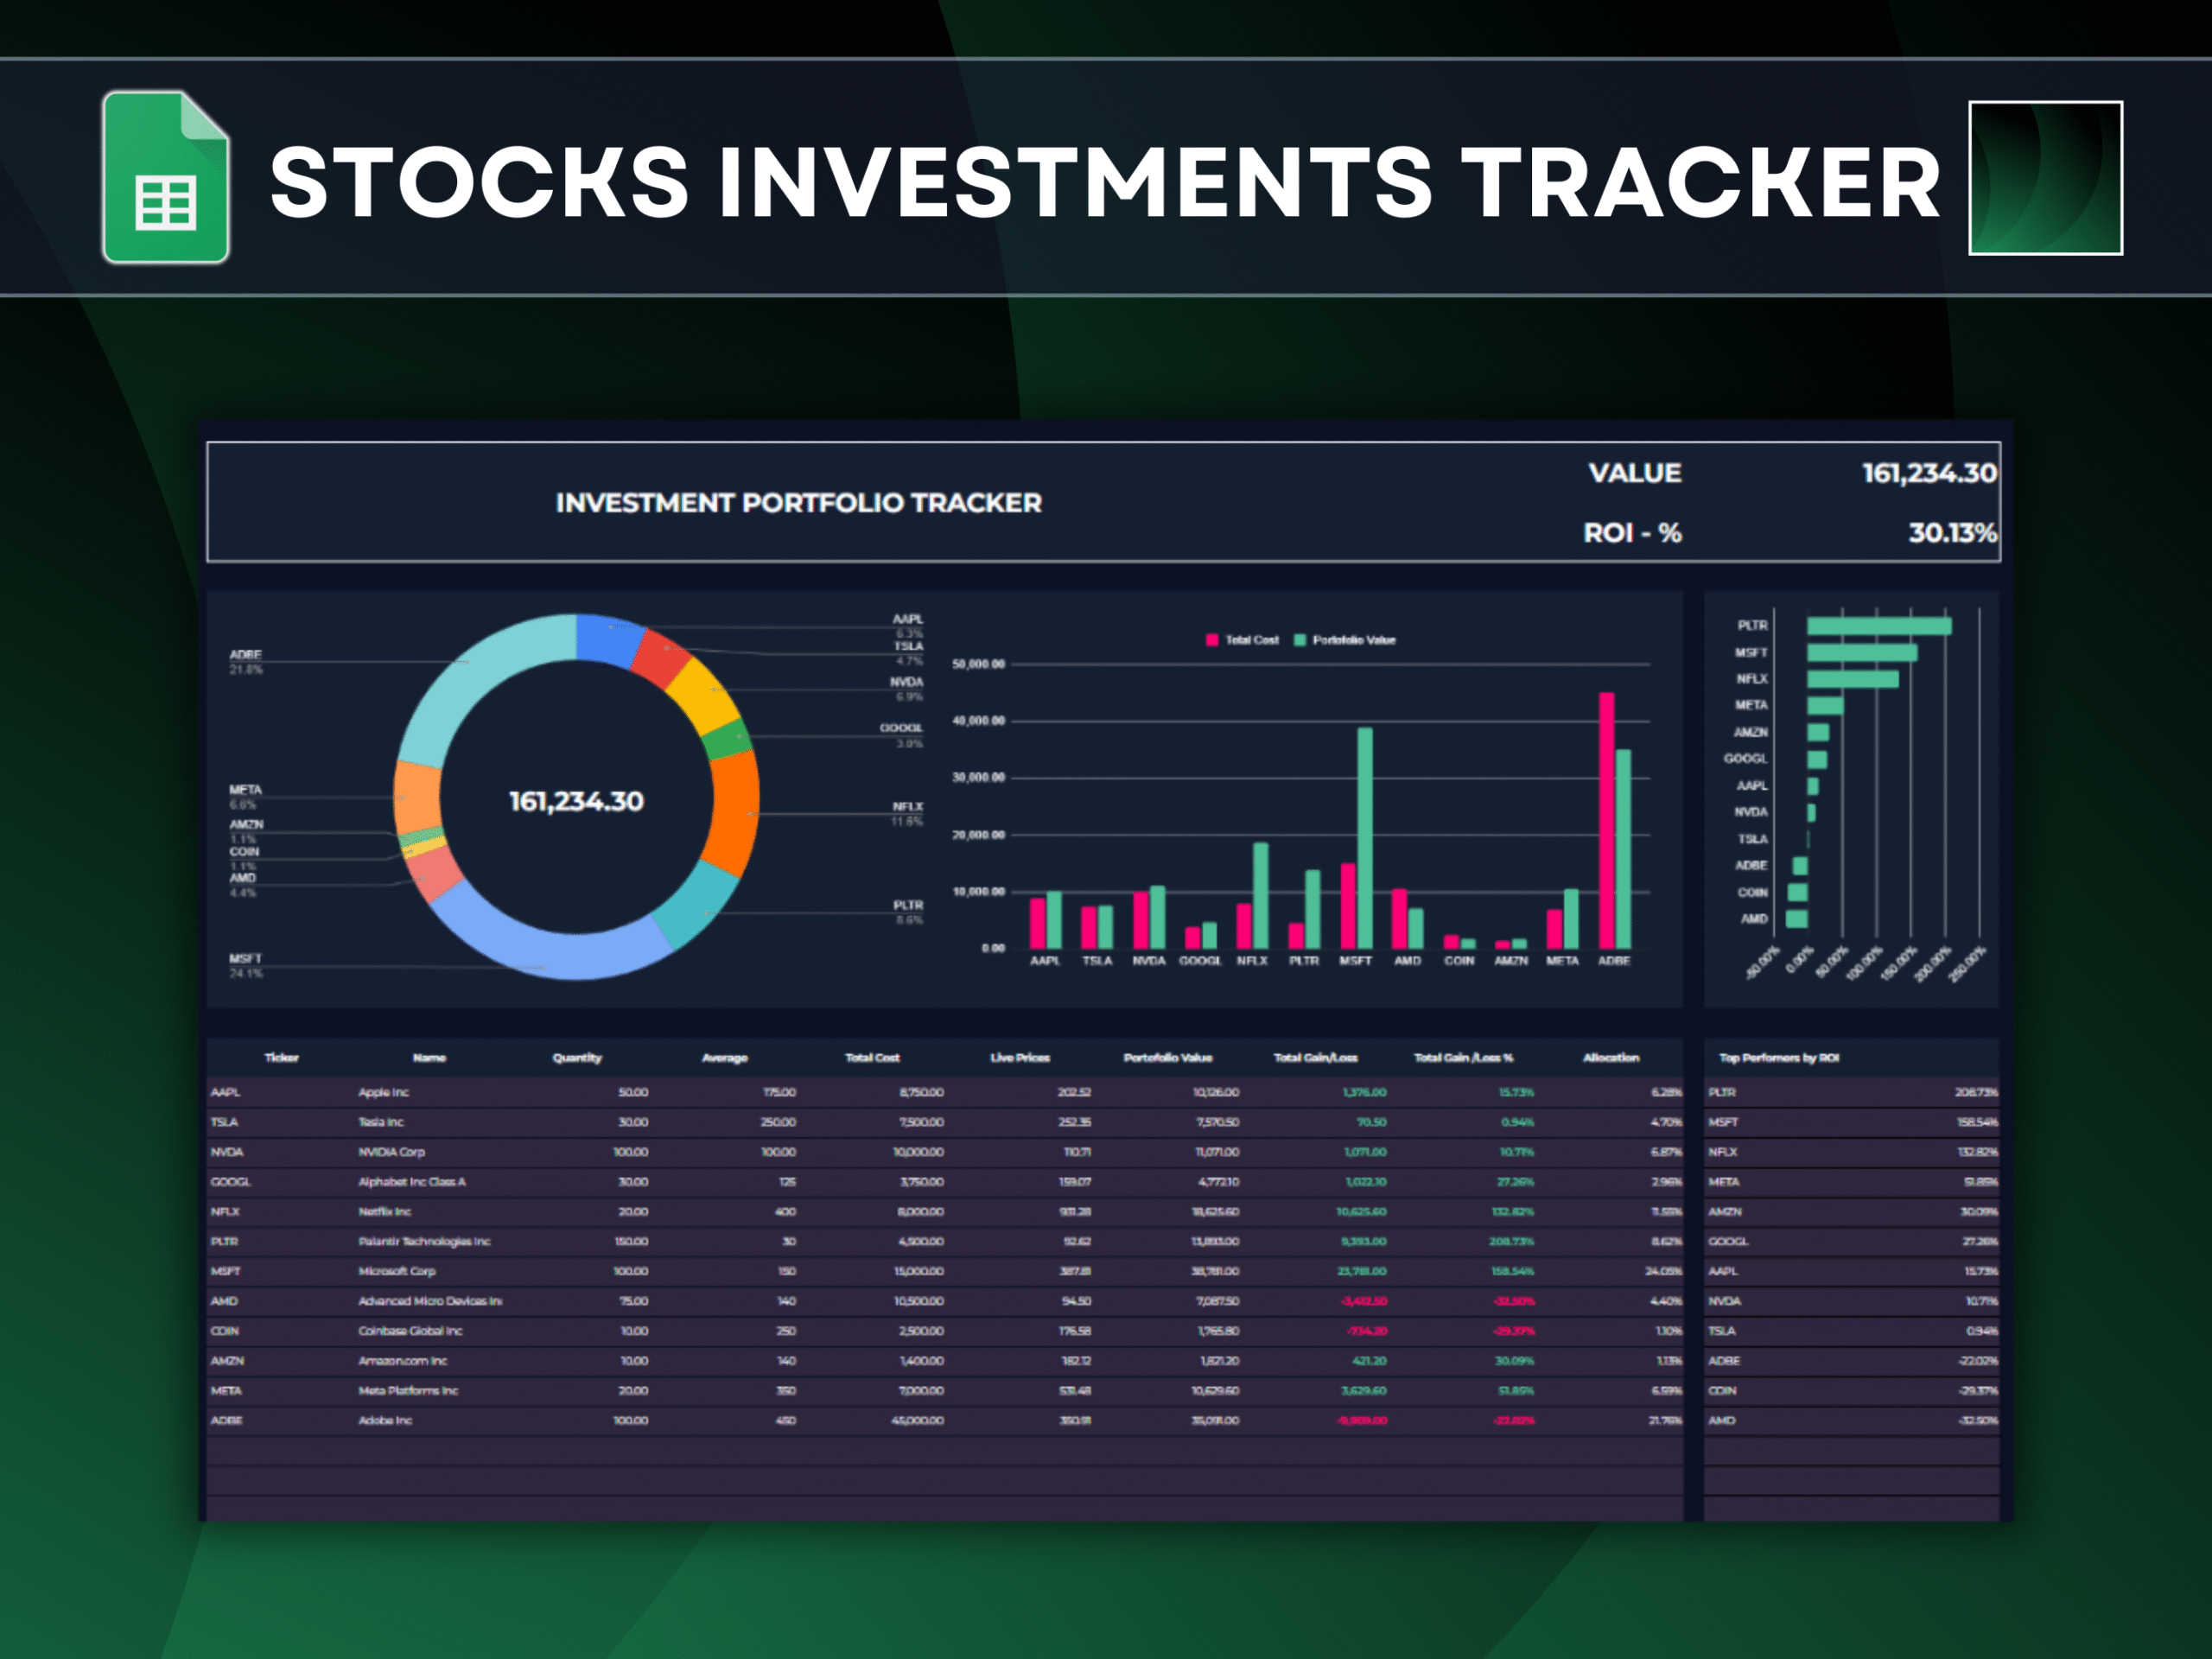
- Dashboard with an allocation donut chart and a cost vs. value column chart
- Top performers section using QUERY for dynamic ranking
- Optional watchlist to monitor tickers before buying
Step 1: Set Up Your Portfolio Sheet
Create columns (suggest starting row at 21 to reserve space for headers and summaries):
- B: Ticker (e.g., AAPL, MSFT, LON:VOD)
- C: Name
- D: Quantity
- E: Average Cost
- F: Total Cost
- G: Live Price
- H: Portfolio Value
- I: Gain/Loss (Value)
- J: ROI (%)
- K: Allocation (%)
Recommended summary cell:
- M2: Total Portfolio Value
Core Formulas (adjust column letters if your layout differs)
- Name (C21):
=IF($B21=””,””,GOOGLEFINANCE($B21,”name”)) - Total Cost (F21):
=IF($B21=””,””,$D21*$E21) - Live Price (G21):
=IF($B21=””,””,GOOGLEFINANCE($B21,”price”)) - Portfolio Value (H21):
=IF($B21=””,””,$G21*$D21) - Gain/Loss (I21):
=IF($B21=””,””,$H21-$F21) - ROI % (J21):
=IFERROR(($H21-$F21)/$F21,””) - Total Portfolio Value (M2):
=SUM($H$21:$H) - Allocation % (K21):
=IF($B21=””,””,$H21/$M$2)
Tips:
- Double-click the fill handle to copy formulas down.
- Use conditional formatting to color-code gains (green) and losses (red).
- Wrap outputs in IF/IFERROR to keep the sheet clean when cells are blank.
Step 2: Build a Clean, Informative Dashboard
A) Asset Allocation Donut Chart
- Insert > Chart > Donut chart
- Data ranges:
- Labels: $B$21:$B
- Values: $K$21:$K
- Style tweaks:
- Remove background and border for a minimal look
- Place a large “Total Portfolio Value” above the chart referencing $M$2
- Ensure label contrast for readability
B) Total Cost vs. Current Value Column Chart
- Insert > Chart > Column chart
- Data ranges:
- Labels: $B$21:$B
- Series 1 (Total Cost): $F$21:$F
- Series 2 (Portfolio Value): $H$21:$H
- Style:
- Distinct colors for cost vs. value (e.g., gray vs. green)
- Remove extra borders, keep fonts consistent with your theme
These visuals deliver instant insights into diversification and performance gaps.
Step 3: Surface Top Performers with QUERY
Create a “Top Performers” block (e.g., starting at M20):
- By absolute Gain/Loss value (descending):
=QUERY($B$21:$K, “select B,J where J is not null order by J desc”, 1) - Show only the top 10:
=QUERY($B$21:$K, “select B,J where J is not null order by J desc limit 10”, 1)
Add a bar or column chart on this result range to visualize leaders and laggards. As prices update, this ranking reshuffles automatically.
Step 4: Optional Watchlist
Create a separate Watchlist sheet with:
- Ticker
- Name
- Price
- Day change, Market Cap, etc. (attributes available via GOOGLEFINANCE)
Example formulas:
- Name:
=IF(A2=””,””,GOOGLEFINANCE(A2,”name”)) - Price:
=IF(A2=””,””,GOOGLEFINANCE(A2,”price”))
Copy down for as many tickers as needed. Consider conditional formatting for large daily moves.
Practical Tips and Troubleshooting
- Handle errors gracefully:
- ROI: IF($F21=0,””,($H21-$F21)/$F21) or IFERROR(…)
- Empty tickers: Wrap outputs with IF($B21=””,””,…)
- International tickers: Use exchange prefixes (e.g., “LON:VOD”, “TSX:SHOP”) to ensure accurate data.
- Update cadence: GOOGLEFINANCE is frequently refreshed but not tick-by-tick; ideal for investors, not intraday scalping.
- Data hygiene: Format currency columns, align decimals, and lock summary cells to avoid accidental edits.
FAQ
- Is GOOGLEFINANCE real-time?
It’s frequently updated but delayed vs. market ticks; perfect for portfolio tracking and long-term investing. - Can this handle ETFs and international tickers?
Yes—use correct exchange prefixes and ticker formats for reliable results. - How do I avoid DIV/0 in ROI?
Wrap with IF ($F21=0,””,…) or IFERROR to suppress errors until costs are entered. - Can I track crypto or funds?
Many assets work, but attributes vary by source coverage. For advanced crypto needs, consider a dedicated API later.
Wealth isn’t built by the loudest headlines—it’s built by quiet, repeatable systems. This tracker is one such system: simple, transparent, and relentlessly useful. Build it once, and let it pay clarity dividends every day.
Leave a Reply